This data is freely available for anyone to download. If you make use of the data, please reference the appropriate publications. Please also state clearly where and how you got the data. Please also consider the possibility of striking up a collaboration that involves this data or future data that is not yet generated.
In Costa et al Neuron 2017 96(1):177-189.e7, quantal parameters p and q were extracted from Sjöström et al, Neuron 2001 as well as from Sjöström et al, Neuropharmacology 2007. The estimated quantal parameters for individual plasticity experiments are available at Mendeley.
In Costa et al eLife 2015;4:e09457, average quantal parameters were extracted in STDP. Estimated changes in p, q and mean weight are available to download at Dryad. The biologically tuned computer model is available at ModelDB.
Sjöström et al, Neuron 2001
Figures 1D and 7B
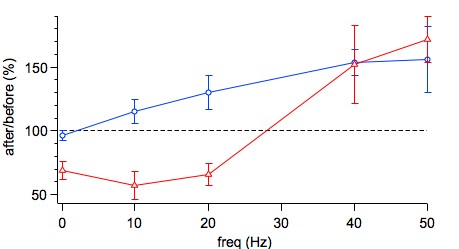 This is the LTP data from Figure 1D and the LTD data from Figure 7B in Sjöström et al, Neuron 2001. As described in the Methods section of this paper, the data was acquired in acute visual cortex slices of roughly P14 rats using paired recordings of monosynaptically connected layer-5 (L5) pyramidal neurons. Baseline period was ten minutes, followed by a 2.3-min-long induction period (except at 0.1 Hz, which was longer). The post-pairing period lasted at least twenty minutes but typically much longer.
This data is available in the following formats: Excel and Igor PXP file, and PDF.
Figure 7D
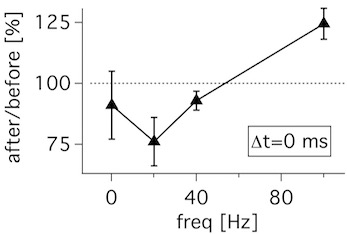 This is the LTP data from Figure 7D in Sjöström et al, Neuron 2001.
This data is available in the following formats: Excel and Igor saved graph, and PDF.
Figure 8
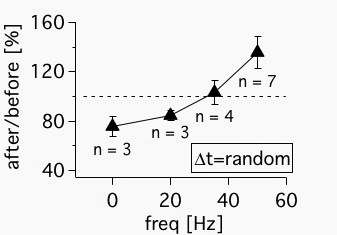 This is the random firing data from Figure 8 in Sjöström et al, Neuron 2001. As described in the Methods section of this paper, the data was acquired in acute visual cortex slices of roughly P14 rats using paired recordings of monosynaptically connected layer-5 (L5) pyramidal neurons. Baseline period was ten minutes, followed by a 2.3-min-long induction period (except at 0.1 Hz, which was longer). The post-pairing period lasted at least twenty minutes but typically much longer. The randomization of spike times was roughly uniform. Each connected pair experienced a new random spiking pattern.
This data is available in the following formats: Excel, Igor saved graph, and PDF.
Song et al, PLoS Biology 2005
Connectivity dataset
With plasticity experiments using quadruple recordings, many cells are not connected. Many connections can also not be used for plasticity experiments, simply because the connections are very weak, or maybe they simply go bad. Fortunately, each quad recording provides a lot of data on the local connectivity. In the Song et al, PLoS Biology 2005 study, we made use of a relatively large quad-recording data set generated this way, consisting of more than 900 connections and 8000 cells.
This data is available in Excel format. The data is arranged as follows:
Date
The date the experiment was conducted.
Attempt#
Each experimental day, I would attempt at getting a quad recording, and I would number each quad attempt.
nConnections
For each quad attempted, the nConnections parameter tells you how many connections I found.
nTested
For each quad attempt, I wouldn't necessarily get all four cells. If I got four, then I tested 12 connections, but if I only got three cells, then I tested 6 possible connections. With two cells, I tested two possible connections.
Age
The age of the animal, probably with a +/- one day slop or less.
CalciumConc
The concentration of calcium in the external solution. The reason this changes between 2.5 mM and 2.0 mM is because I modelled some of my studies on Feldman Neuron 2001 and Markram Science 1997. The former employed 2.5 mM, whereas the latter used 2.0 mM external calcium. The calcium concentration may affect both the amplitude and the CV of synaptic connections.
ConnectionString
Each quad recording has a ConnectionString associated with it, which uniquely identifies the connectivity pattern within the quad. For example, on 20/01/2001, Attempt #1, the string is 3_4,0.00020913,9.5405e-05; 4_3,0.00034122,0.00012075; 3_2,0.00050473,9.8416e-05; 2_3,0.00060293,0.00011659; 2_4,0.00060349,0.00013282; 1_4,0.0005404,0.00010957;. This means cell three was connected to cell 4 with a connective strength of 0.20913 mV and the standard deviation of that connection was 9.5404E-5 V. That pair also had a reciprocal connection from cell four to cell three, of 0.34122 mV strength, and so on and so forth. If the string says NA, then there was no connection found.Note that all bad recordings were discared before this analysis stage, so recorded cells that were deemed bad were not included in the table -- this is important for obtaining correct connectivity counts.
Sjöström and Häusser, Neuron 2006
Figure 3
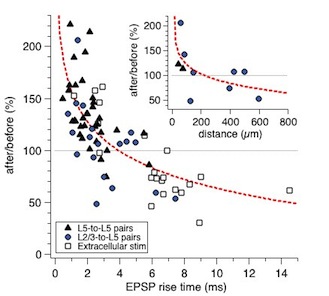 This figure shows the dependence of synaptic plasticity on synapse location as shown in Fig 3 of Sjöström and Häusser, Neuron 2006. The data was acquired in acute neocortical slices of two-to-three-week-old rats using paired recordings of monosynaptic layer-2/3-to-layer-5 connections or layer-5-to-layer-5 connections between pyramidal neurons. Some experiments were also done with extracellular stimulation, either in L2/3 or in L5. Baseline period was ten minutes, followed by the 2.3-min-long induction period. The same induction protocol was used in all cases: five spikes at 50 Hz in both pre and postsynaptic neurons, temporally shifted at +10 ms pre before post, repeated 15 times every 10 seconds. For connections close to the soma, this protocol reliably results evokes LTP (cf Sjöström et al, Neuron 2001). Note, however, that for connections that are far away from the soma--i.e. connections with EPSPs that have slow risetime due to dendritic cable filtering--this protocol actually evokes LTD instead. Inset graph shows the same results but with respect to the Euclidian distance between the putative synapse and the soma, as ascertained using either 2-photon imaging or Neurolucida. Note that the dendritic path length was not measured, nor the dendrite branch thickness, which are two parameters that probably influence the results considerably too.
This data is available in the following formats: Excel, Igor saved graphs (LTP vs risetime, and LTP vs putative location), and PDF.
Figure 4D
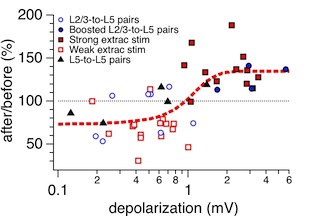 This figure shows the dependence of synaptic plasticity of distal synaptic inputs (EPSP rise time > 3 ms, roughly >200 micron from the soma) on depolarization during the induction as measured at the soma. This is Figure 4D in Sjöström and Häusser, Neuron 2006. The data was acquired as described for Figure 3 above, also see Methods section of paper itself.
There are essentially two conditions in this graph: "Large" and "Small" EPSPs. Large EPSPs are such that they boost backpropagating action potentials, thus enabling LTP of distal inputs, whereas Small EPSPs are not large enough to provide this boosting (cf Stuart & Häusser, Nat Neurosci 2001, and model therein). These two conditions, however, were generated in different ways: As unitary connections between L2/3 and L5 pyramidal cells (PCs), or between L5 and L5 PCs, as L2/3-to-L5 connections that were boosted using extracellular stimulation during the induction. The two remaining conditions were generated with extracellular stimulation in L2/3, but with different stimulation strength: "Strong" or "Weak". In all cases, the data was selected for rise time larger than 3 ms, either post hoc (monosynaptically connected pairs) or during the experiment itself (extracellular stimulation).
Note that although the depolarization during the induction was measured in the soma, the relevant measure is the depolarization in the dendrite. This, however, is hard to get at.
This data is available in the following formats: Excel, Igor saved graph, and PDF.
Figure 7B
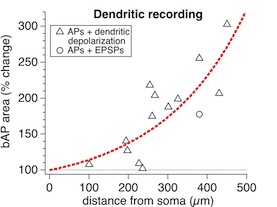 This figure shows the boosting of backpropagating action potentials by dendritic depolarization, shown as Figure 7B in Sjöström and Häusser, Neuron 2006. The dendritic depolarization was achieved either with a dendritic patch electrode or with extracellular stimulation in L2/3. Similar results have previously been reported e.g. by Williams & Stuart (J. Neurosci. 2000, 20, 8238-8246).
This data is available in the following formats: Excel, Igor saved graph, and PDFs of the original figure and of unpublished data on spike height and width (a subset of this data was shown in the sample in Figure 7A of Sjöström and Häusser, Neuron 2006). Note that the Excel table includes the unpublished data too.
Figure 7E
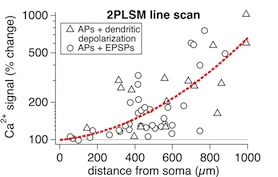 This figure shows the depolarization-mediated boosting of calcium signals triggered by backpropagating action potentials, as shown in Figure 7E of Sjöström and Häusser, Neuron 2006. As with Figure 7B above, the dendritic depolarization was achieved either with a dendritic patch electrode or with extracellular stimulation in L2/3. Taken together with Figure 7B, these results indicate that it is possible to use the boosting of spike-triggered calcium signals in any one given position of the dendritic tree as an index or a proxy of the boosting of the dendritic action potentials themselves.
This data is available in the following formats: Excel, Igor saved graph, and PDF.