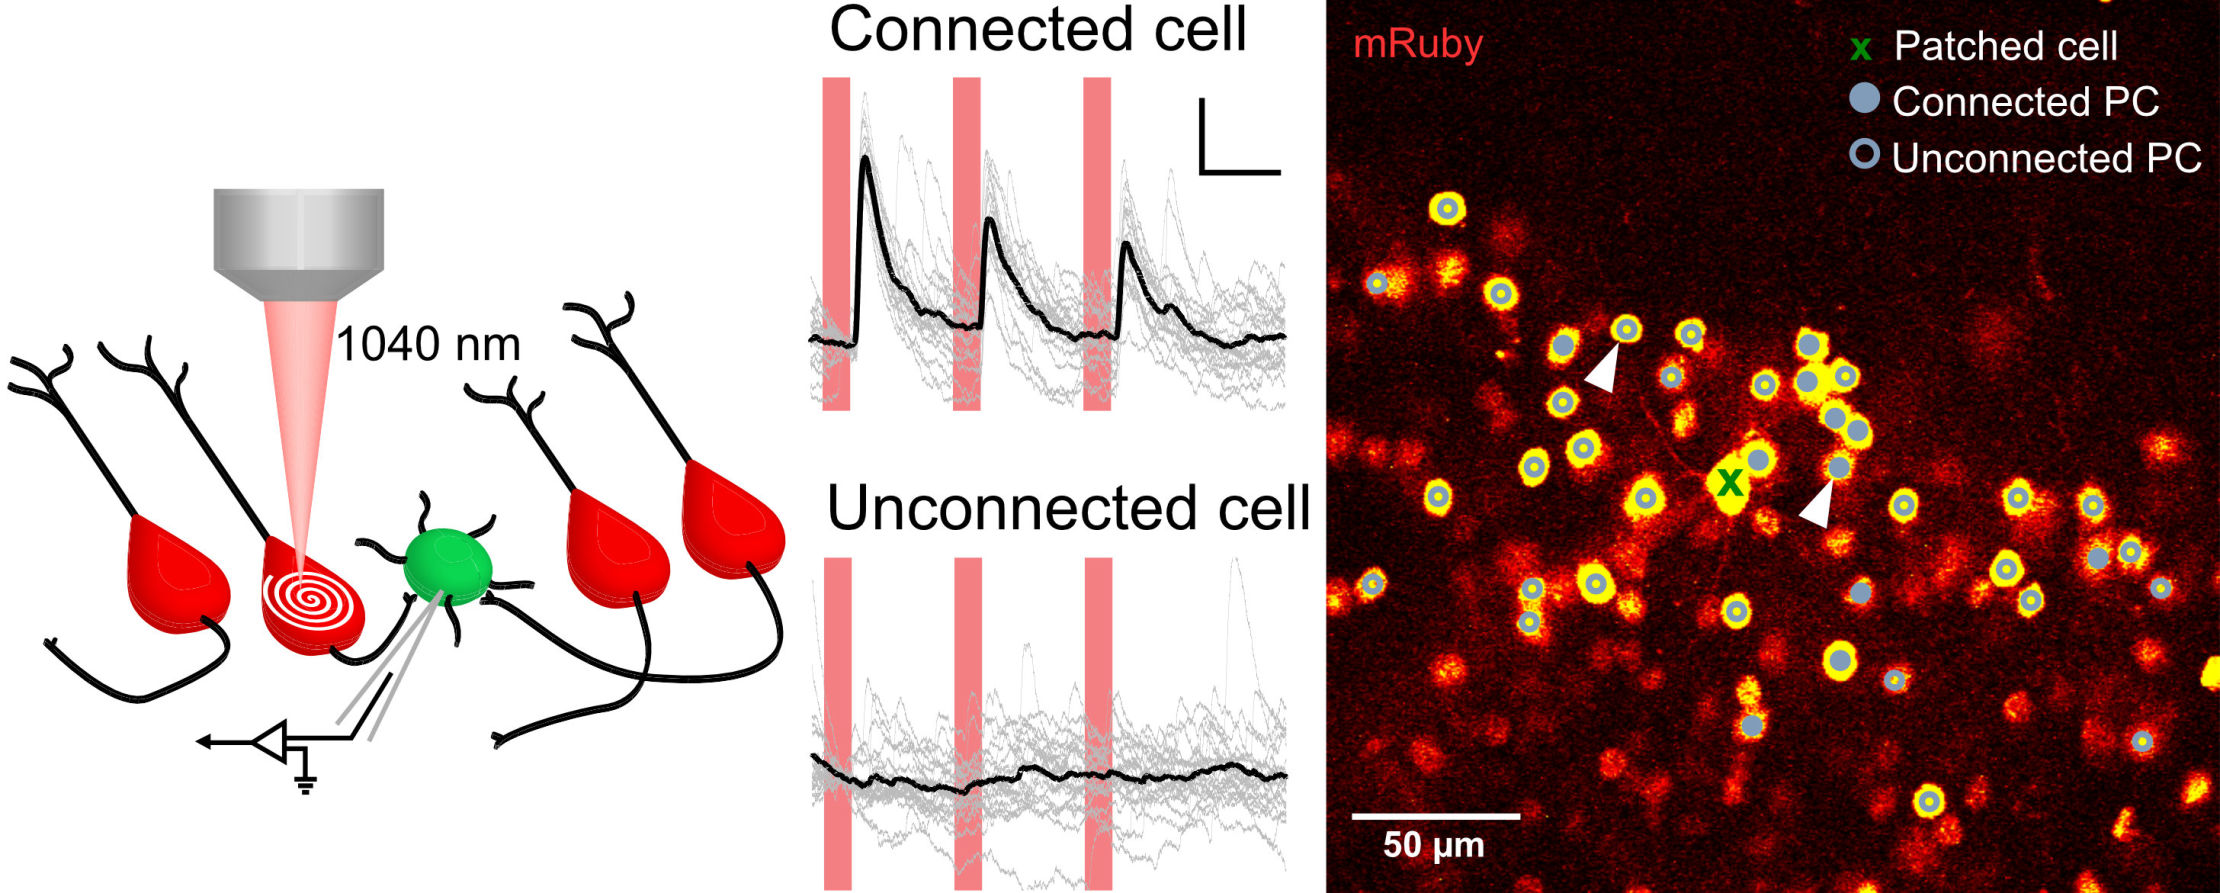
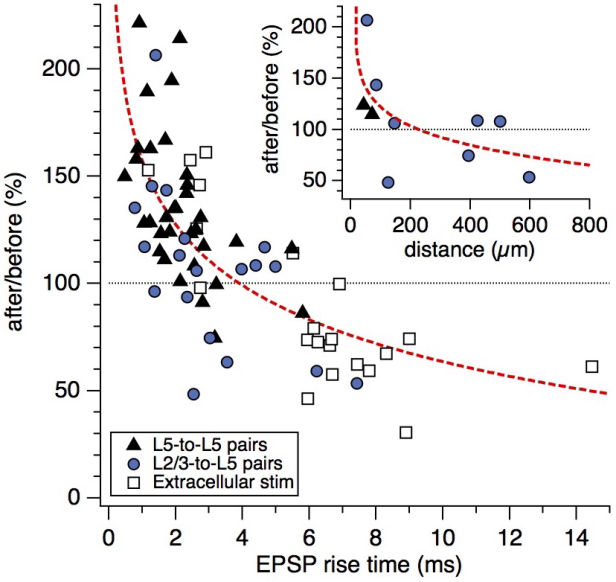
Location Dependence of Synaptic Plasticity: See Fig 3 of Sjöström and Häusser, Neuron 2006. Baseline period was ten minutes, followed by the 2.3-min-long induction period. The same induction protocol was used in all cases: five spikes at 50 Hz in pre- and postsynaptic neurons, temporally shifted at +10 ms, repeated 15 times. Inset graph shows the same results but with respect to the Euclidian distance between the putative synapse and the soma. Note that the dendritic path length was not measured, nor the dendrite branch thickness.
Formats: Excel | Igor saved graph 1 | Igor saved graph 2 | PDF
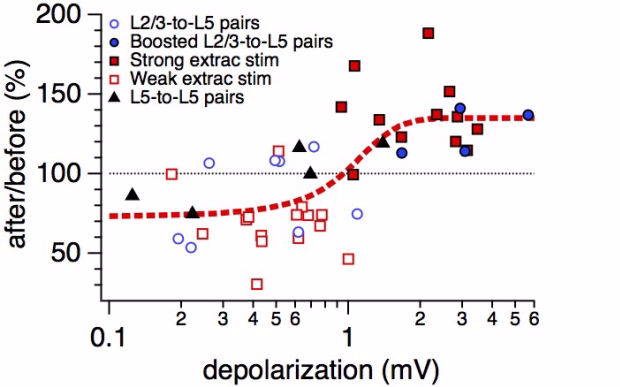
Fig. 4D in Sjöström and Häusser, Neuron 2006 shows the dependence of synaptic plasticity of distal synaptic inputs (EPSP rise time > 3 ms, roughly >200 micron from the soma) on depolarization during the induction as measured at the soma. Formats: Excel | Igor saved graph | PDF
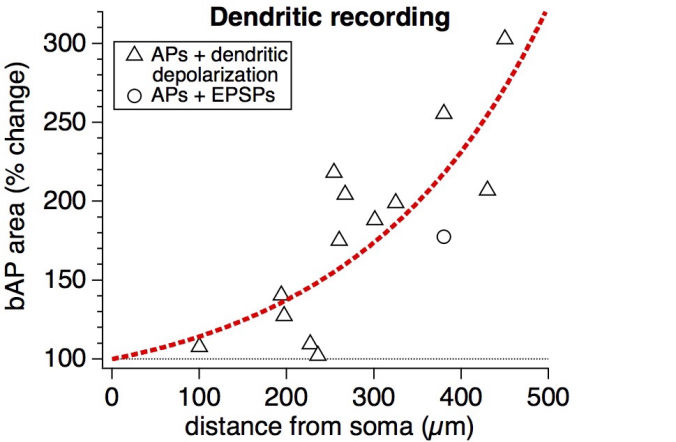
This figure shows the boosting of backpropagating action potentials by dendritic depolarization, shown as Figure 7B in Sjöström and Häusser, Neuron 2006. The dendritic depolarization was achieved either with a dendritic patch electrode or with extracellular stimulation in L2/3. Formats: Excel | Igor saved graph | PDF | Unpublished PDF
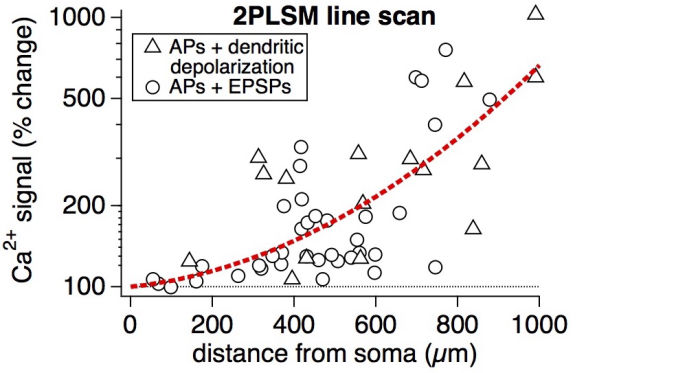
This figure shows the depolarization-mediated boosting of calcium signals triggered by backpropagating action potentials, as shown in Figure 7E of Sjöström and Häusser, Neuron 2006. As with Figure 7B above, the dendritic depolarization was achieved either with a dendritic patch electrode or with extracellular stimulation in L2/3. Formats: Excel | Igor saved graph | PDF
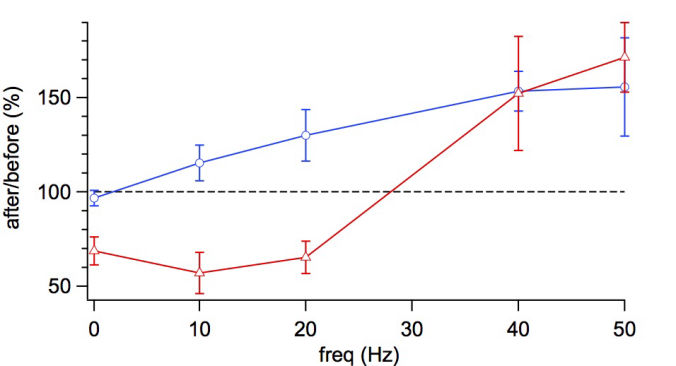
Plasticity data from Fig. 1D and LTD data from Fig. 7B in Sjöström et al, Neuron 2001. Baseline period was 10 min, followed by a 2.3-min-long induction period, except at 0.1 Hz, which was longer. Formats: Excel | Igor PXP | PDF
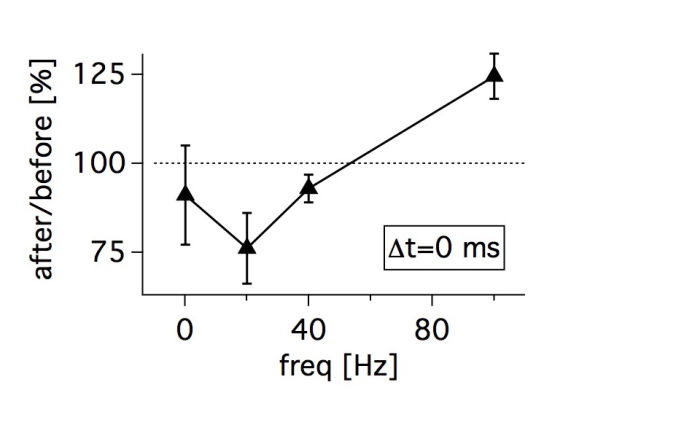
Plasticity data from Fig. 7D in Sjöström et al, Neuron 2001. Formats: Excel | Igor saved graph | PDF
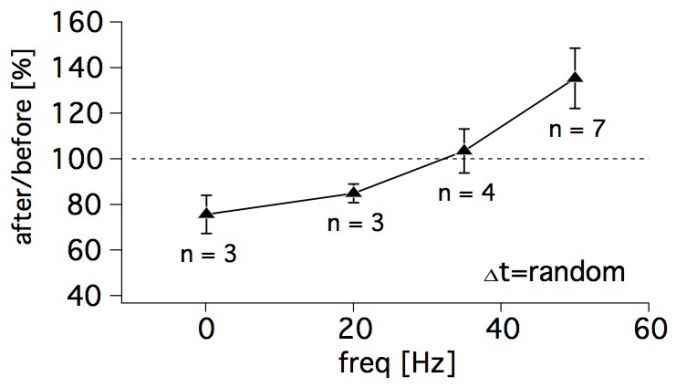
Random firing data from Fig. 8 in Sjöström et al, Neuron 2001. Randomization was roughly uniform. Each connected pair experienced a new random spiking pattern. Formats: Excel | Igor saved graph | PDF
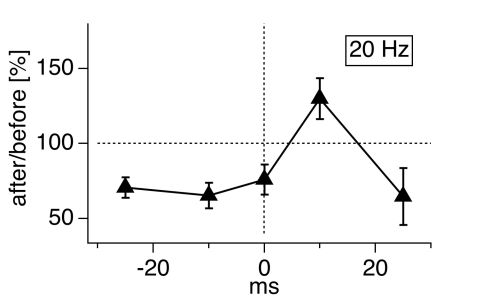
Plasticity data for 0.1 Hz, 20Hz and 40/50 Hz from Fig. 7C in Sjöström et al, Neuron 2001. Formats: Excel
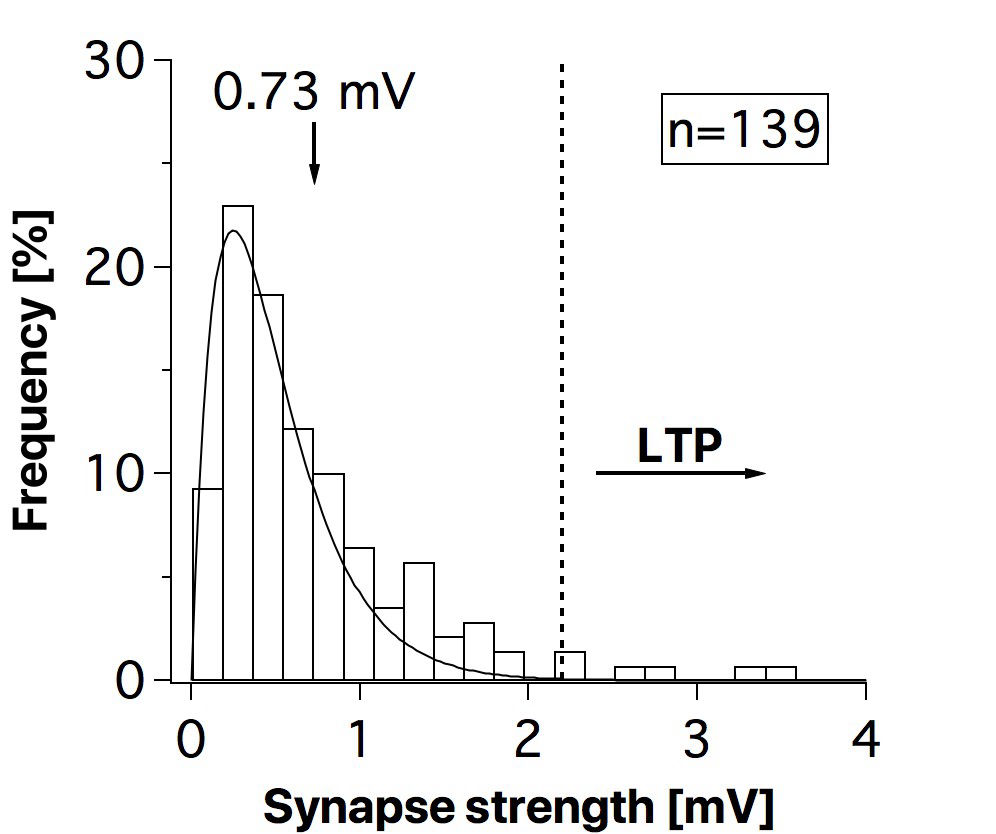
EPSP amplitude data from Fig. 3C in Sjöström et al, Neuron 2001. Formats: Excel | PDF
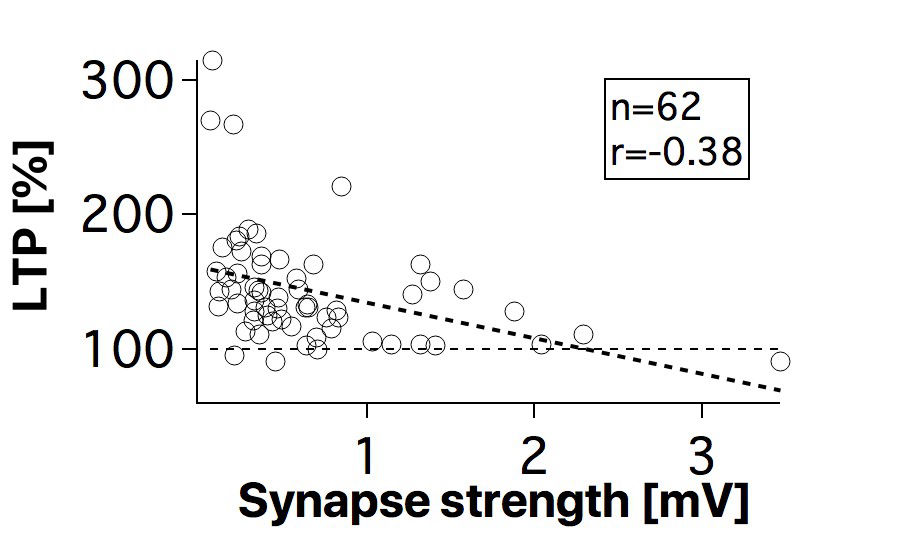
LTP data from Fig. 5C in Sjöström et al, Neuron 2001. Formats: Excel | PDF
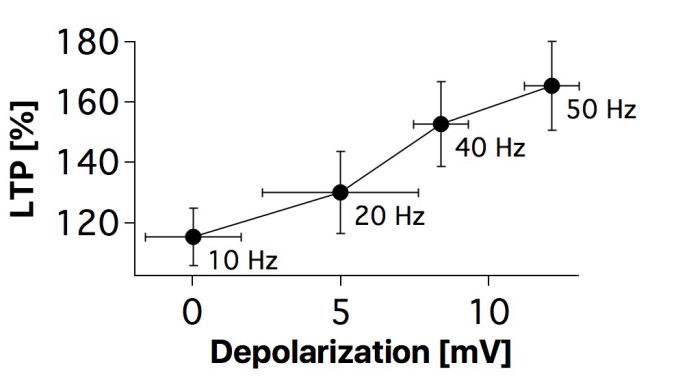
LTP and membrane voltage data from Fig. 5E in Sjöström et al, Neuron 2001. Depolarization before spike was averaged across spikes in a burst. Formats: Excel | PDF

AI Website Maker